
Introduction to AWS X-Ray
AWS X-Ray helps to analyze and debug applications by providing end-to-end view of requests as it travels through the application, and shows a map of the application’s underlying components. AWS X-Ray helps understand the application and its underlying services execution to identify and troubleshoot the root cause of performance issues and errors.
Step1: Pre-Requisite
You need to have an AWS account with administrative access to complete the exercise. If you don’t have an AWS account, kindly use the link to create free trial account for AWS.
Step2: Create IAM Role
You start with creation of the IAM role which Amazon API Gateway uses for the authorization to call other AWS Services.
-
Login to the AWS Console. Select Paris as the region.
-
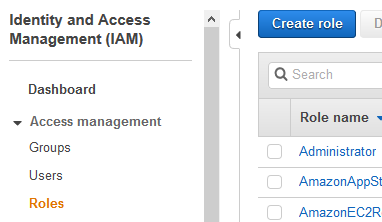
Goto the IAM Management console and click on the Roles menu in the left and then click on the Create role button.
-
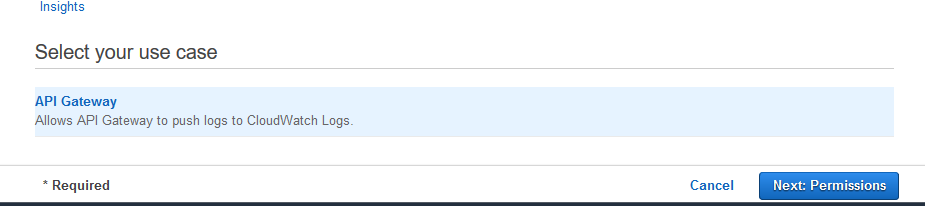
On the next screen, select API Gateway as the service and click on the Next: Permissions button.
-
On the next screen, click on the Next: Tags button.
-
On the next screen, click on the Next: Review button.
-
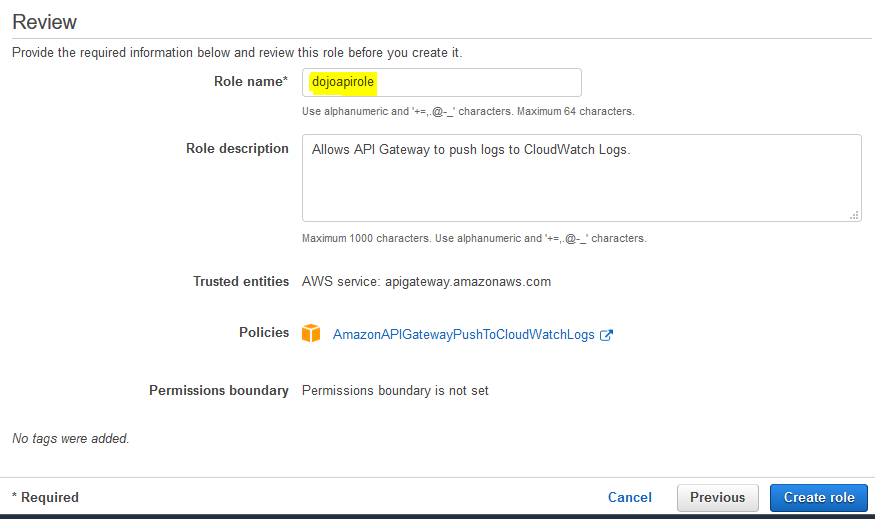
On the next screen, type in dojoapirole for the Role name and click on the Create role button.
-
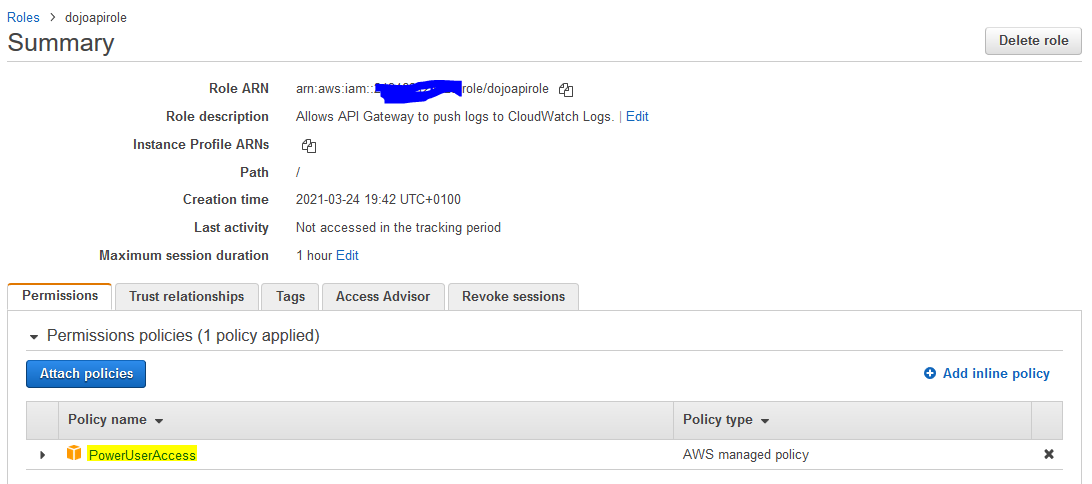
The role is created in no time. Open the role details. Remove AmazonAPIGatewayPushToCloudWatchLogs policy attached to the role and associated PowerUserAccess policy.
-
The role is ready. You configure Lambda functions in the next step.
Step3: Create Lambda Function
You create two Lambda functions which are called by the state machine workflow in Step Functions.
-
Goto Lambda Management console and click on the Create function button.
-
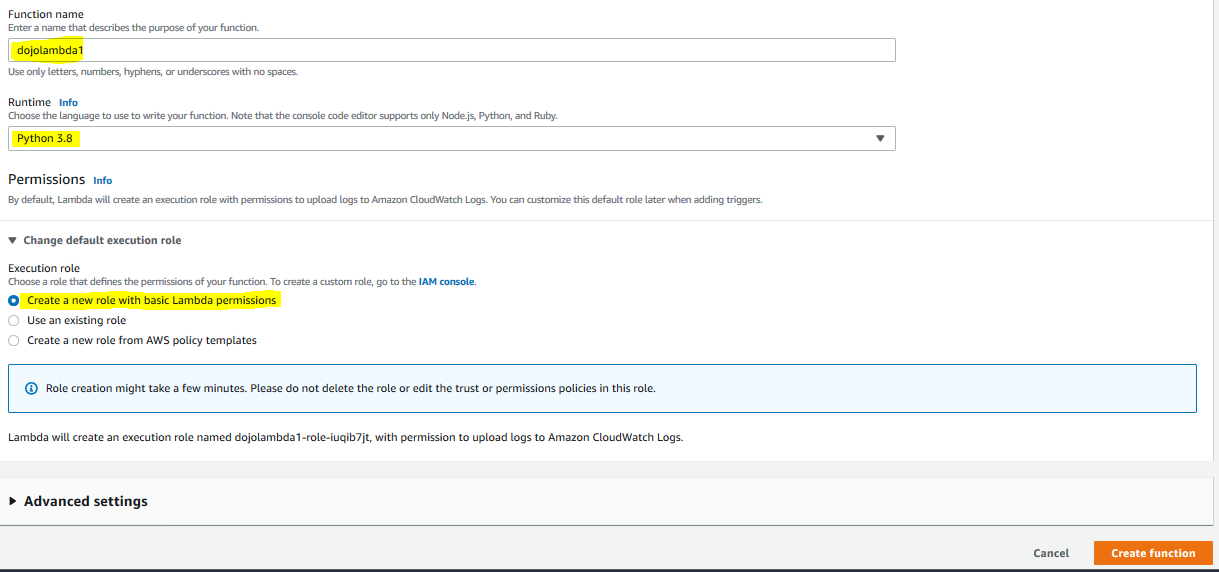
On the next screen, select Author from scratch as the option. Type in dojolambda1 as the Function name. Select Python 3.8 as the Runtime. Under Permissions, select Create a new role with basic Lambda permissions as the option and then click on the Create function button.
-
The Lambda function is now ready. Goto the Function code setting for the lambda function and replace the code with the following code below and then click on the Deploy button.
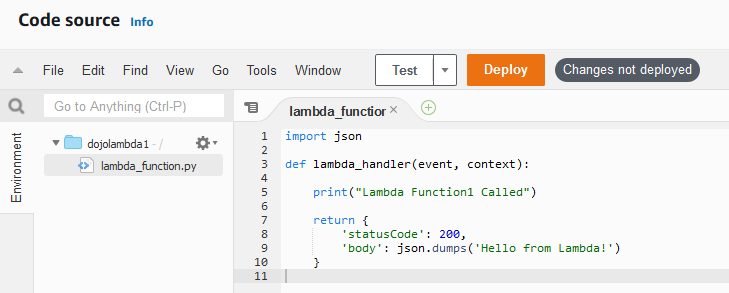
import json

def lambda_handler(event, context):

    print("Lambda Function1 Called")

    return {
        'statusCode': 200,
        'body': json.dumps('Hello from Lambda!')
    }
-
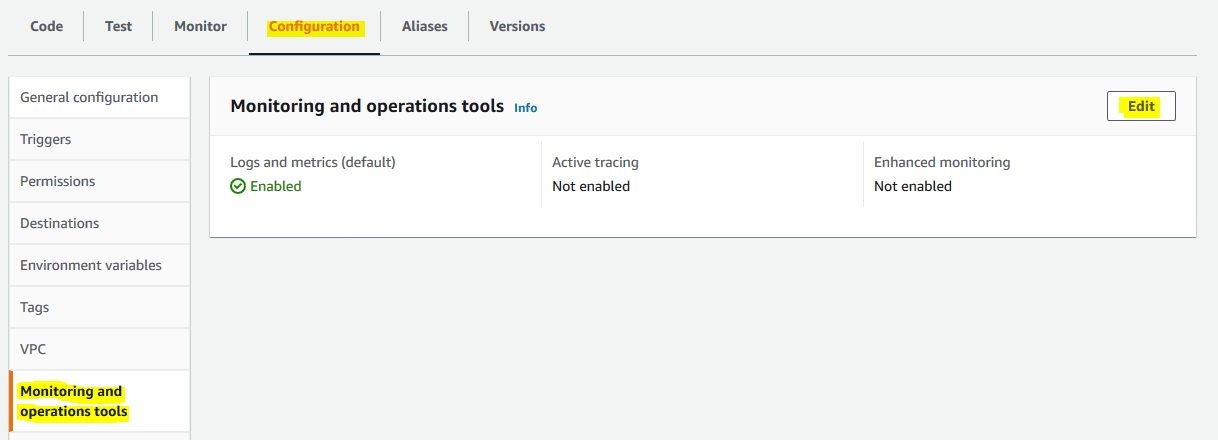
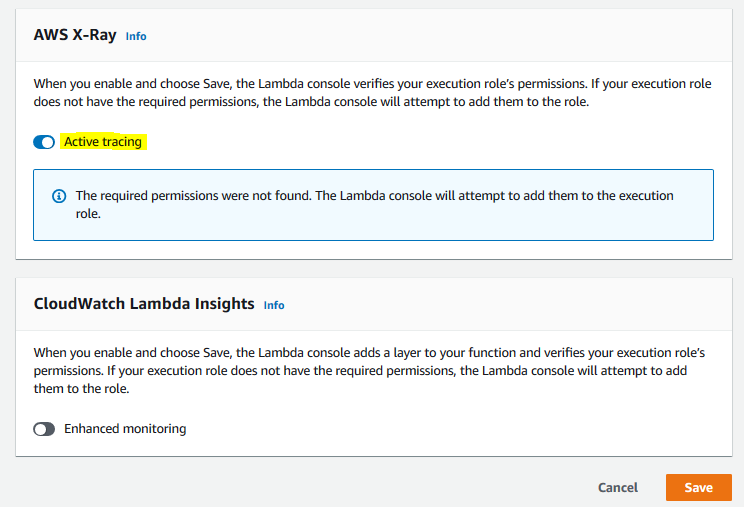
The function code is updated. The code is very simple. It is simply logging the call to the function. For the function, click on the Configuration tab, click on the Monitoring and operations tools in the tab and finally click on the Edit button.
-
On the next screen, enable Active tracing for AWS X-Ray and click on the Save button.
-
The lambda function has got AWS X-Ray enabled. Repeat step 1 to 5 to create another lambda function with name dojolambda2. Use the following as the code.
import json

def lambda_handler(event, context):

    print("Lambda Function2 Called")

    return {
        'statusCode': 200,
        'body': json.dumps('Hello from Lambda!')
    }
- The lambda functions are ready. Please make note of the ARNs of both Lambda functions. You configure a State Machine Workflow in Step Functions.
Step4: Configure Step Function
You create state machine workflow in AWS Step Functions which orchestrates the two lambda functions.
-
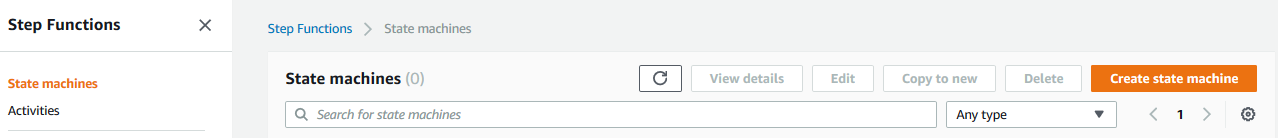
In the AWS Step Functions Console, click on the State machines option in the left menu and then click on the Create state machine button.
-
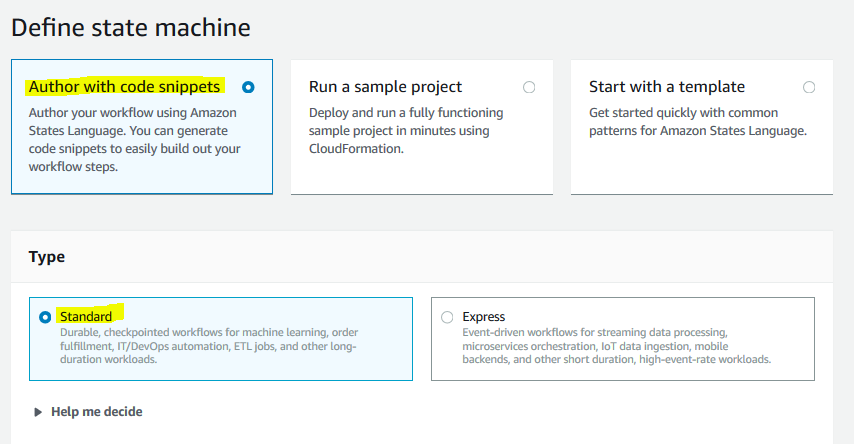
On the next screen, select Author with code snippets option. Select Standard for type.
-
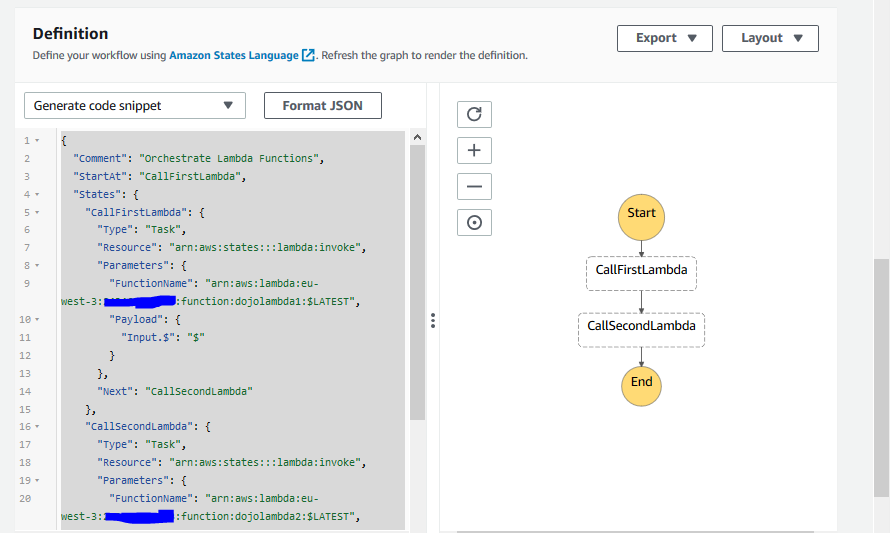
On the same screen, in the Definition section, replace the state machine configuration with the json given below. Replace the {LAMBDA1-ARN} and {LAMBDA2-ARN} values with the ARN of the two lambda functions you created earlier.
{
  "Comment": "Orchestrate Lambda Functions",
  "StartAt": "CallFirstLambda",
  "States": {
    "CallFirstLambda": {
      "Type": "Task",
      "Resource": "arn:aws:states:::lambda:invoke",
      "Parameters": {
        "FunctionName": "{LAMBDA1-ARN}:$LATEST",
        "Payload": {
          "Input.$": "$"
        }
      },
      "Next": "CallSecondLambda"
    },
    "CallSecondLambda": {
      "Type": "Task",
      "Resource": "arn:aws:states:::lambda:invoke",
      "Parameters": {
        "FunctionName": "{LAMBDA2-ARN}:$LATEST",
        "Payload": {
          "Input.$": "$"
        }
      },
      "End": true
    }
  }
}
`
-
In the configuration above, you are calling the two lambda functions in sequence. Click on the Next button.
-
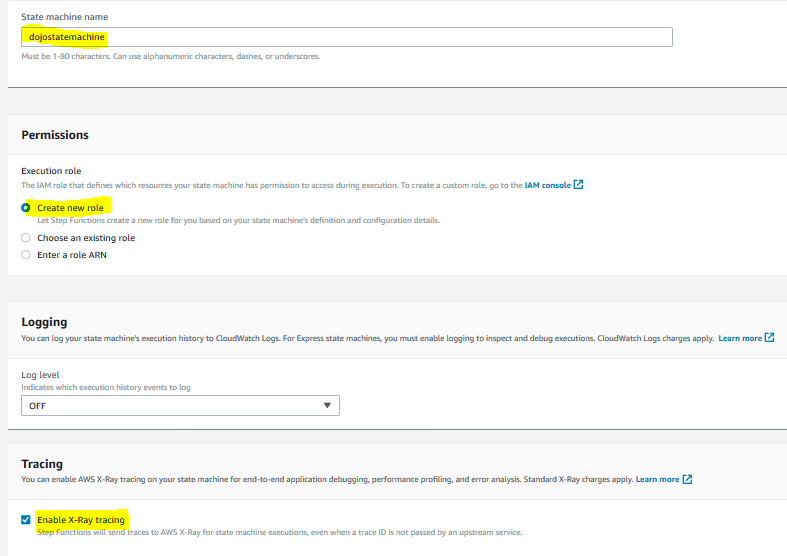
On the next screen, type in dojostatemachine for the state machine name. Select Create new role option. Also check the Enable X-Ray tracing option. Keep rest of the configuration to the default and click on the Create state machine button.
-
The state machine workflow is created. Make note of the ARN of the state machine workflow you created. In the next step, you call the state machine workflow from an API in the API Gateway.
Step5: Configure API in API Gateway.
In this step, you configure REST API in API Gateway which calls state machine workflow as the backend.
-
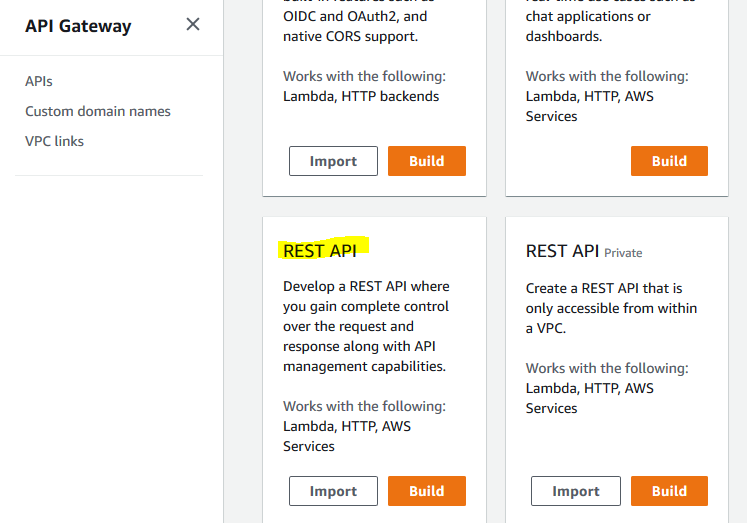
In the API Gateway Console, click on the Build button for the REST API.
-
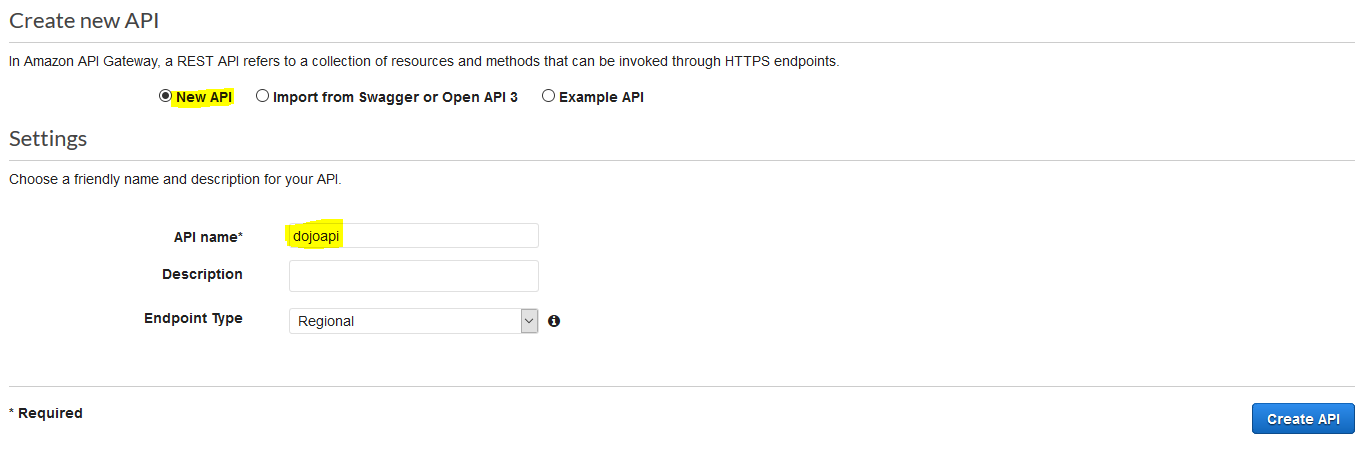
On the next screen, select New API option. Type in dojoapi for the API Name. Keep rest of the configuration to the default and click on the Create API button.
-
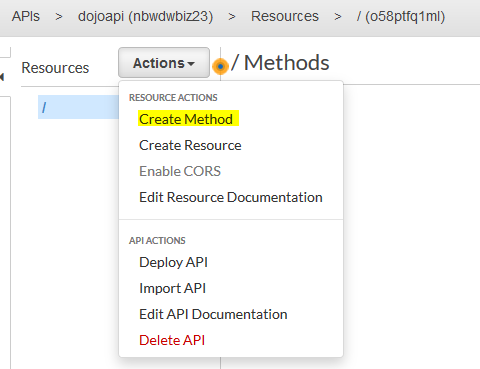
The API is created in no time. On the next screen, click on the Create Method option under the Action menu.
-
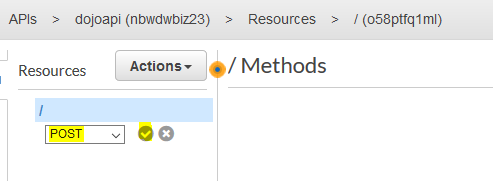
On the next screen, select POST as the method and click on the confirmation icon.
-
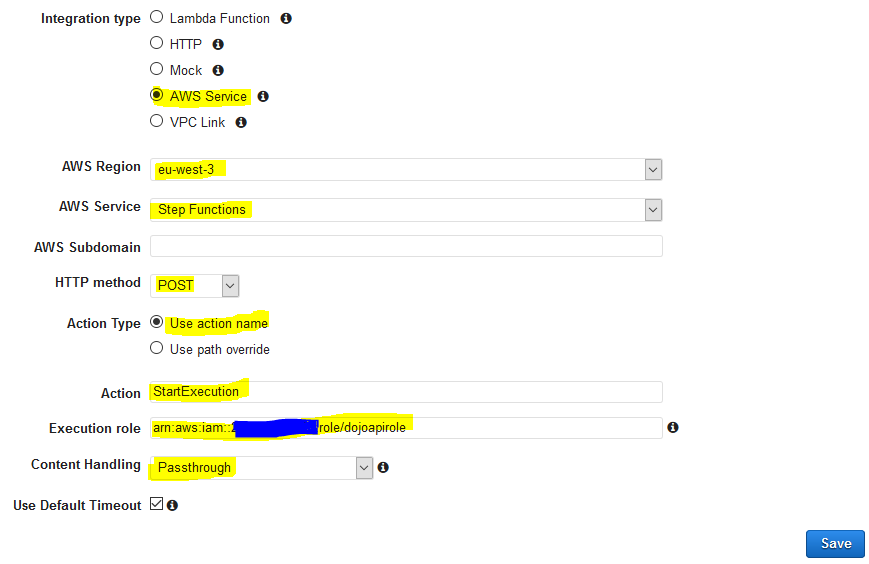
The method is created in no time. On the next screen, select AWS Service option for the integration type. Select eu-west-3 as the AWS Region. Select Step Functions as the AWS Service. Select POST as the HTTP Method. Select Use action name for the Action Type. Type in StartExecution for the Action. Type in ARN of the API IAM Role you created in the previous step to the Execution role field. Select Passthrough for the Content Handling. Finally, click on the Save button.
-
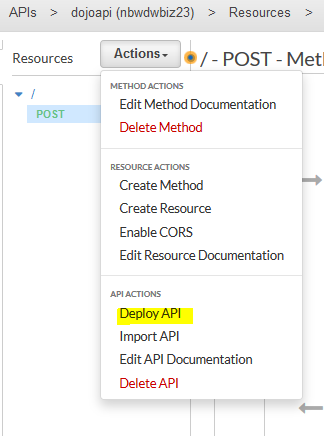
The method is updated. On the next screen, click on the Deploy API option under the Action menu.
-
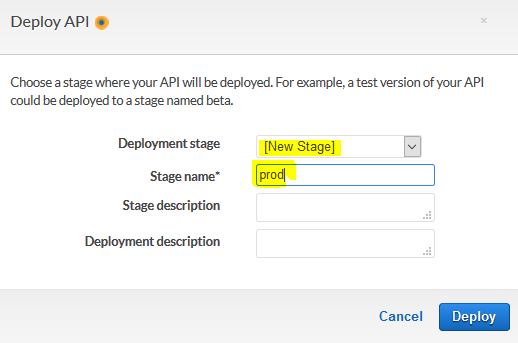
It will throw popup to configure the deployment stage. Select [New Stage] as the deployment stage. Type in prod for the stage name and click on the Deploy button.
-
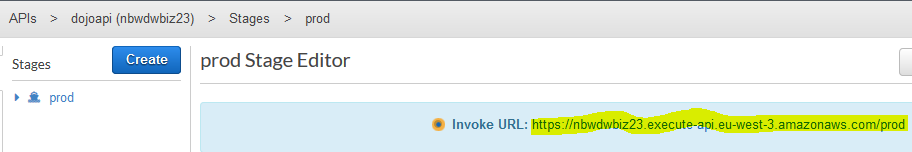
The API is deployed to the prod stage. Make note of the Invoke URL. You will need it later when calling the API.
-
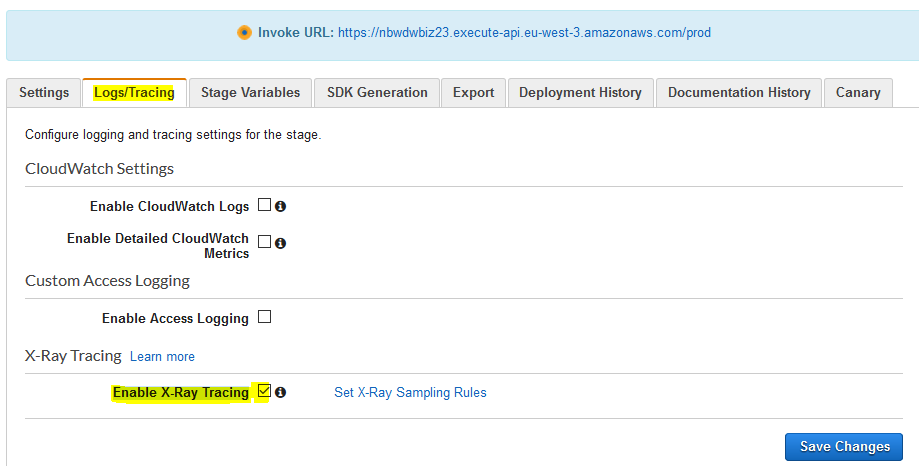
The API is deployed and ready. Click on the Logs/Tracing tab. Check Enable X-Ray Tracing option and click on the Save Changes button.
-
Tracing is enabled for the API. In the next step, you call the API using PostMan.
Step6: Call the API
The exercise would use PostMan to call the API. You can call another tool which you are comfortable with. If you wish, you can download PostMan from the link.
-
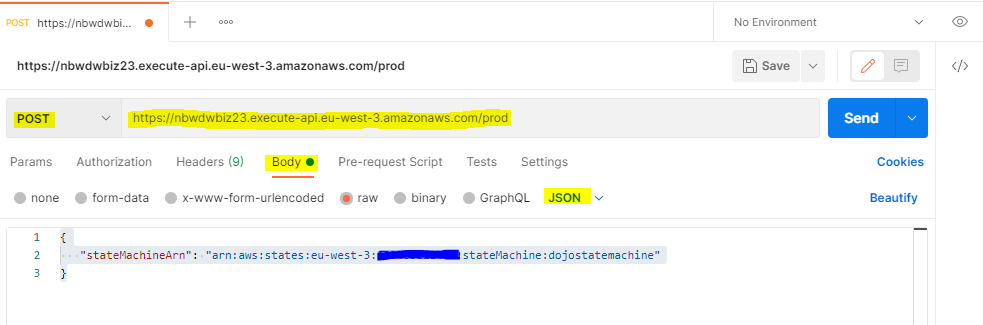
Open PostMan. Select POST as the method. Type in the API URL which you made note of in the previous step. Select Body tab. In body tab, copy-paste the following json as the message. In the message, replace {STATE_MACHINE_WF_ARN} with the ARN of the state machine workflow you created earlier. Select JSON as the content type. Finally, click on the Send button.
{
   "stateMachineArn": "{STATE_MACHINE_WF_ARN}"
}
`
-
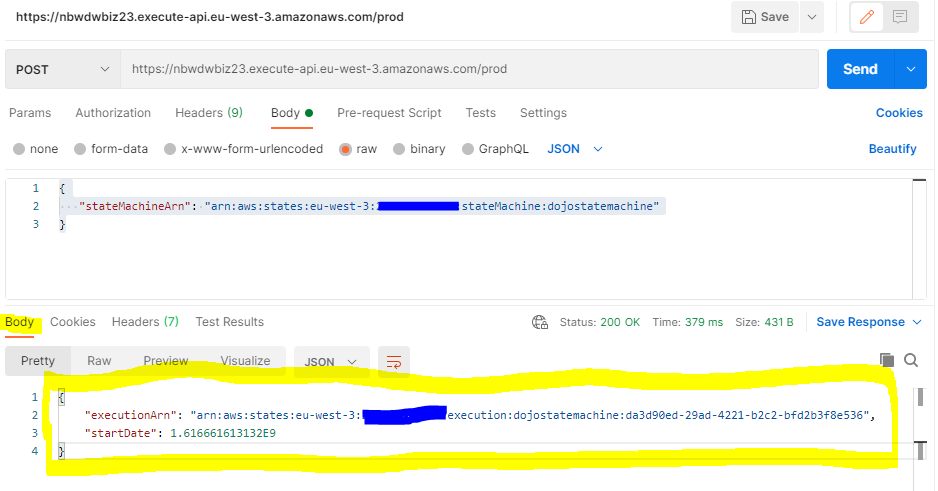
The API is called successfully. You can see that in the body of the response message.
-
You can repeat the previous steps to call the API couple of more times. In the next step, you check the service map and trace in AWS X-Ray.
Step7: View the Trace
You called the API couple of times. Let’s view the service map and trace in AWS X-Ray.
-
Goto AWS X-Ray console. Click on the Service Map link in the left side menu and then click on the refresh icon.
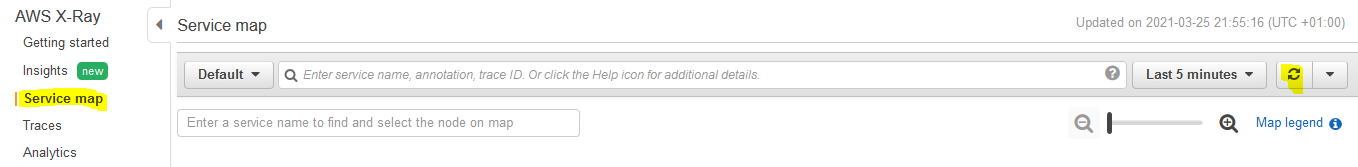
-
For the first time, it might take some time to create the service map. You then see the service map showing the complete call trace from API to State Machine Workflow to Lambda Functions.
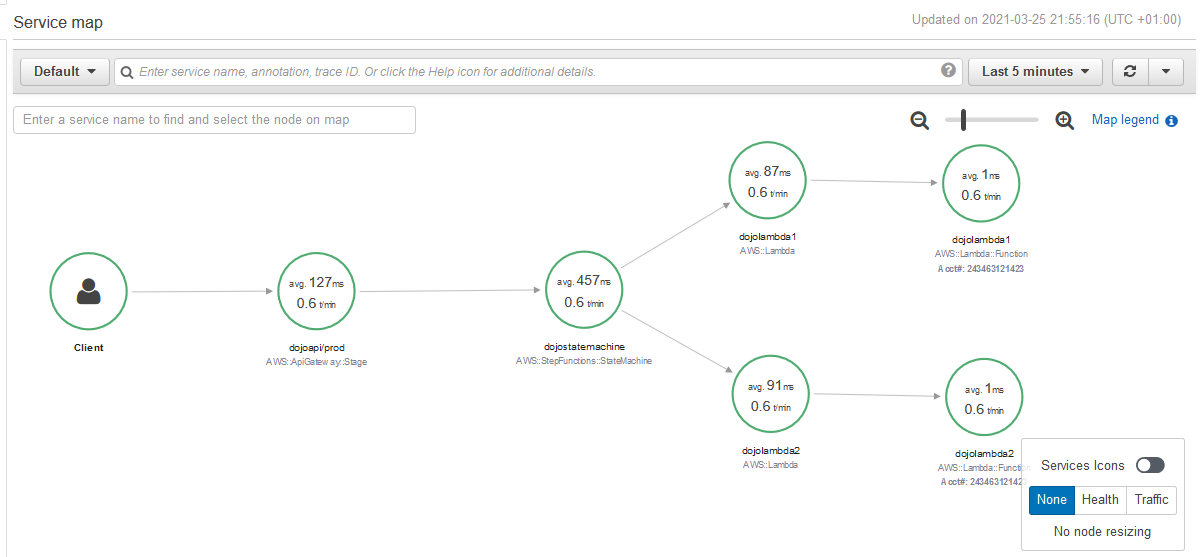
-
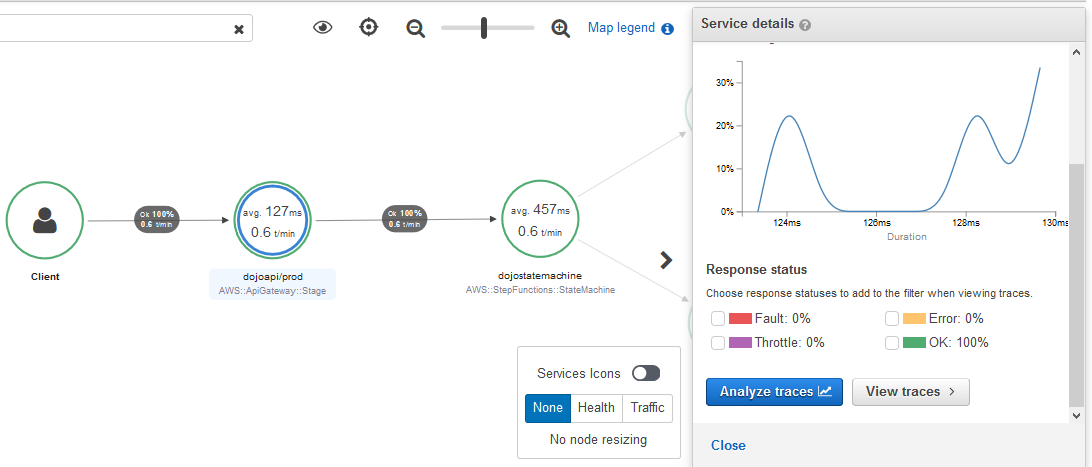
You can click on the node in the service map to check component level details and traces.
-
Click on the Traces link in the left side menu to check list of traces. You can see three calls made to the API and individual call level trace.
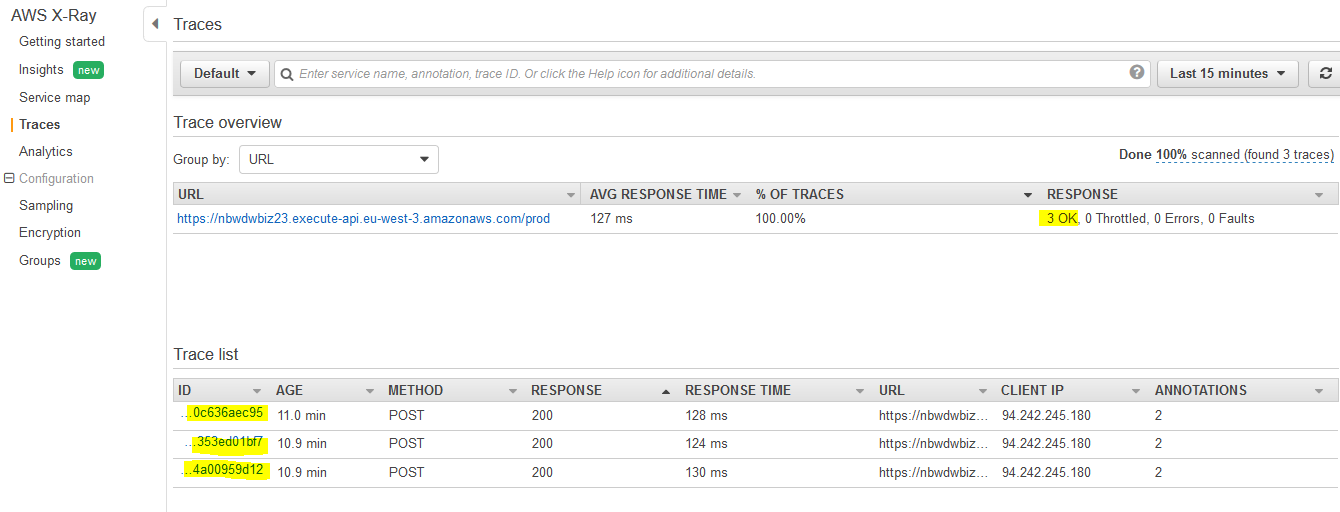
-
Click on the one of the call level trace to see the call stack details.
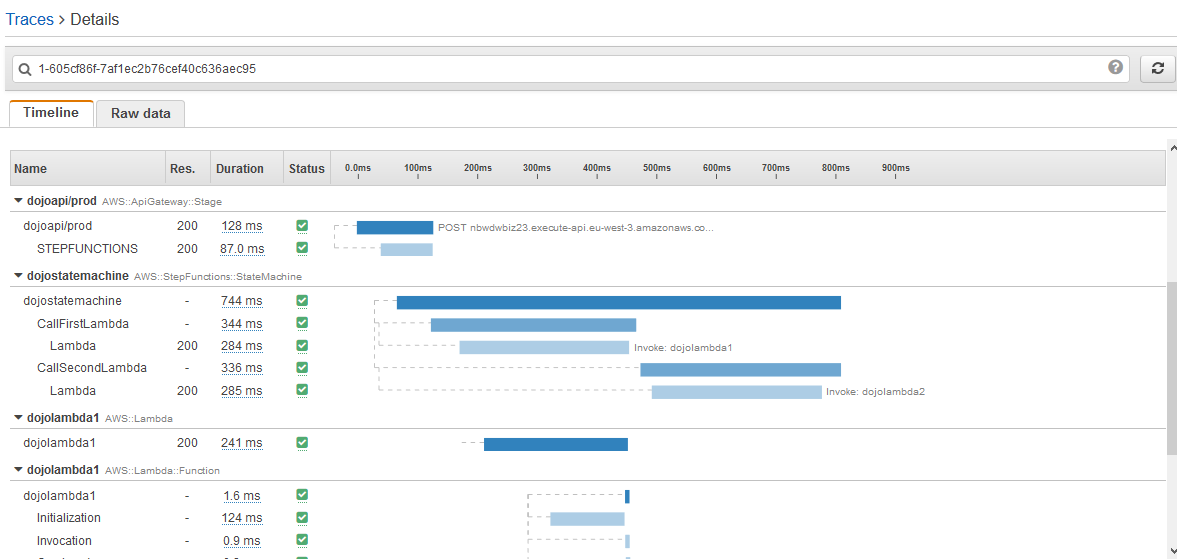
-
You can explore the trace details further. This finishes the exercise. Follow the next step to clean up the resources so that you don’t incur any cost post the exercise.
Step8: Clean up
Delete dojoapi API in API Gateway.
Delete dojolambda1 and dojolambda2 Lambda Functions.
Delete dojostatemachine State Machine Workflow.
Delete dojoapirole IAM role from the IAM Management console.
Thanks and hope you enjoyed the exercise.