In this step, you use Jupyter Notebook to analyze the data published in IoT Analytics Data Set.
-
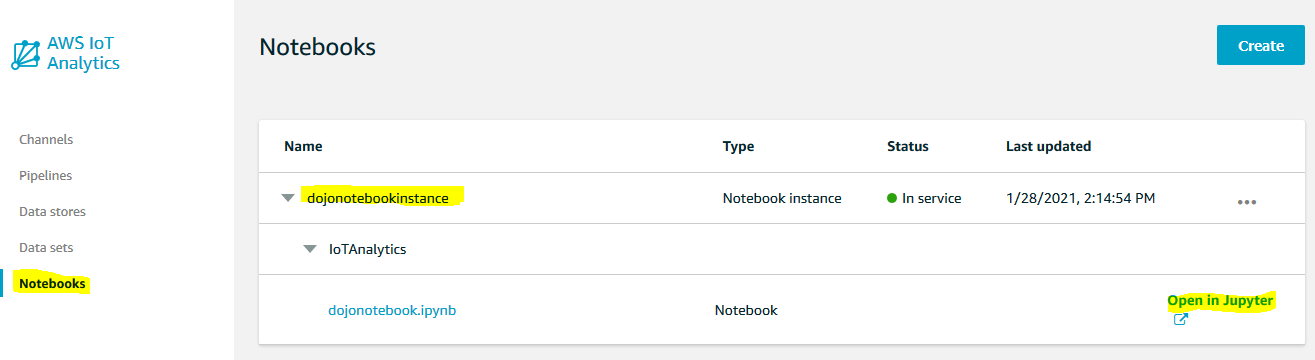
Goto AWS IoT Analytics management console and click on the Notebooks menu in the left. Expand the details for the dojonotebookinstance and click on the Open in Jupyter link.
-
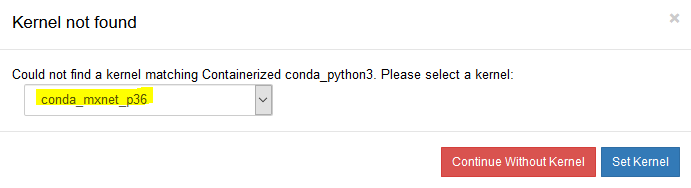
It will open Jypyter Notebook in a new browser window or tab. It shows popup for Kernel not found. Select conda_mxnet_p36 as the kernel and click on the Set Kernel button.
-
The notebook already has some code generated. Run the code in the first cell which creates boto3 client for the IoT Analytics.

-
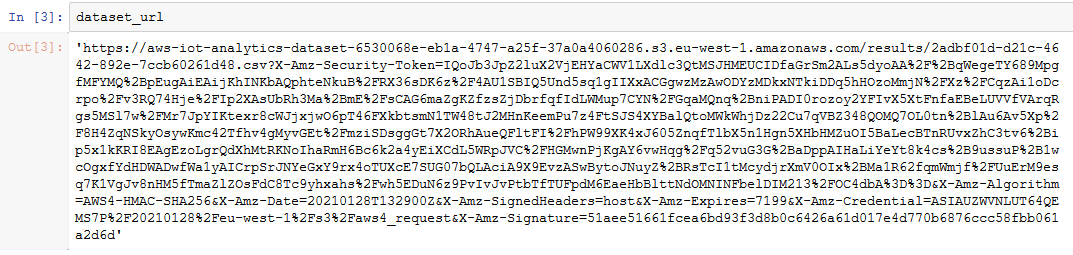
Run the next cell which gets signed S3 URL dataset_url for the IoT Analytics data set data which is stored in the S3 bucket.

-
Add another cell and run code to print the value of the S3 signed URL dataset_url.
-
Add another cell and run the following code to import pandas and matplotlib libraries for the data analysis. Use read_csv method to read data from the S3 bucket and populate into df dataframe. Finally, print the data from the dataframe.
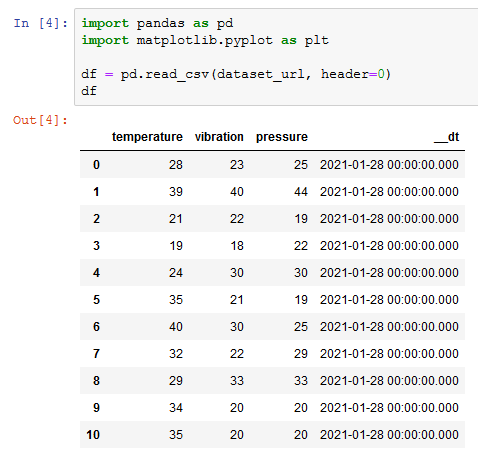
import pandas as pd
import matplotlib.pyplot as plt

df = pd.read_csv(dataset_url, header=0)
df
-
You have all the freedom to analyze the data the way you want. For the workshop purpose, run the following code to plot vibration against pressure in the bar graph.
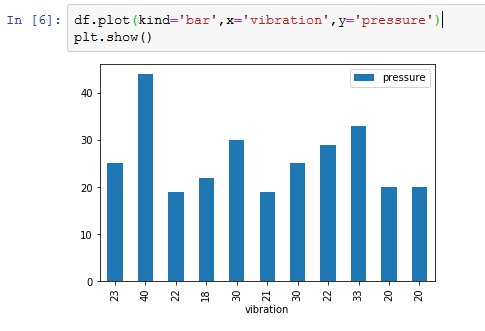
df.plot(kind='bar',x='vibration',y='pressure')
plt.show()
- There are many other analysis you can do and we leave that to your interest and curiosity. The workshop finishes here. Follow the next step to clean-up the resources so that you don’t incur any cost post the exercise.